Field notes from building TokenScale in the open, the real traffic numbers, the honest retrospectives, and the occasional failure caught in the act.
Will BiltonBilton ProjectsBuilding in public since May 2026
↓
The short version
This is the build-in-public journal for TokenScale:
real traffic numbers, what they mean, where things are heading, and the occasional failure,
explained in the same plain terms the tool uses for AI pricing.
New here? TokenScale was built on a phone across 11 months of AI conversations
by an animation professional and former software QA engineer who could code, but never called
himself a full developer.
Entries are condensed to the headline and opening paragraph.
1522 August 2026
Weekend check-in: the record
When the Cache Lies
The nightly numbers had started to look almost suspiciously tidy. Night after night,
TokenScale was accounting for all 66 tracked prices with the kind of consistency I had spent
months trying to build. That should have felt reassuring. Instead, now that I know the system
well enough to recognise its habits, I found myself asking: what could still be wrong when
everything looks right?
So this weekend I went looking for the least glamorous thing I could audit hard. I was already
working on Basic, TokenScale’s direct off-ramp for experienced
visitors who know what they want: the same prices and provenance in one table, without first taking
the guided route through the calculator.
The full TokenScale experience teaches by turning tokens, tiers and context windows into
something familiar. Basic is the side door for people who already know the terrain. It does not
replace the learning experience. It lets advanced users go straight to the record, the source
links and the exports.
When things look too tidy
Building that side door turned into an audit of everything the two views share. It is no longer
enough for me to see every price accounted for and feel relieved. I wanted to know whether each
number came from tonight’s source, whether it had been carried from an earlier date, and whether
options such as Batch and Cache really applied to that exact model.
That took me back through the nightly receipts and deeper into the evidence behind the rows. By
the end, I had a private Price Desk, a stricter closing record, two grey flagship prices and a
new respect for one of computing’s least glamorous words: cache.
A cache is usually helpful. It remembers something so the next request can be answered faster
or more cheaply. Browsers cache pages. Servers cache files. AI providers cache repeated input.
Search engines cache old versions of the web.
The trouble is that memory and evidence are not the same thing. A cache can faithfully remember
an answer that is no longer the answer.
One word, three different jobs
Today I found myself dealing with three different kinds of cache at once.
The first was the kind AI companies sell. If a model can reuse part of a prompt it has already
processed, the cached input may cost less. That sounds wonderfully simple, which is precisely
why it is dangerous to put one big Cache discount switch on a calculator and
call the job finished.
There is no single cache rule. One model publishes a reduced read price. Another charges to
create the cache. Another adds a storage period or a time-to-live rule. Some restrict which
requests qualify. Some interact with Batch pricing. Some publish no exact amount at all.
A cached price can mean a read price, a write price, a storage charge, a time limit, a model
restriction, or simply “we know this exists, but the provider has not published enough to
calculate it.”
So TokenScale now treats Batch and Cache as model-specific facts. The public calculator can use
an exact Batch rule where one is established. Cache remains watch-only until the same standard
can be met for every calculation it would expose. Tonight’s record accounts for 66 tracked
models: 23 have supported Batch rules, five are explicitly unsupported and 38 remain
unestablished. That last word matters. Unestablished does not mean free. It does not
mean unavailable. It means the published evidence is not complete enough to calculate.
The cache that saves evidence
The second cache was mine.
TokenScale’s nightly work already produces detailed local receipts. They record which 22
official provider routes were opened, what happened to all 66 tracked prices, which Batch rules
were found, what the Cache sweep saw and why anything had to be carried forward.
Today I added an owner-only Price Desk that stores a safe reading copy of those receipts. It is
searchable, keeps corrected revisions instead of overwriting them, and gives me one place to see
the standard price, Batch evidence, Cache evidence and any unresolved hold together.
That kind of memory is useful because it is labelled. It has a date, a source, a status and a
preserved revision. It does not merely say, “here is a number.” It says why that number was
allowed into the record.
The cache that can fool you
The third cache was the awkward one.
At 8:04 tonight, Together’s official pricing table showed TokenScale’s tracked Kimi K2.6
row at the familiar $1.20 input and $4.50 output per million tokens. At the independent 10:04
closing read, the row had gone. Kimi K3 and K2.7 Code were still there, but K2.6 was not. Fresh
later reads agreed with the close, and Together’s current
serverless model catalog omitted it too.
An older cached search result could still remember K2.6 and its price. That was useful evidence
that the row had existed. It was not current evidence that the row still existed.
Cerebras presented the same problem more steadily. Its current
public model catalog listed Gemma
4 31B and GPT-OSS 120B, but not TokenScale’s tracked ZAI-GLM-4.7. The exact public endpoint
returned 404. The previous $2.25 input and $2.75 output price is known. It simply was not
verified tonight.
The closing read has to win
This created a slightly uncomfortable choice. Should the successful 8 PM read remain black
because it had genuinely happened? Or should the failed 10 PM read turn the price grey?
The answer has to be grey. TokenScale is a nightly closing record, not a scrapbook of the most
convenient observation collected during the evening. If the source changes between reads, the
close controls that date.
Tonight therefore finished with 64 of 66 prices verified. Together and Cerebras each have one
flagship price carried forward in grey. The prices did not become zero. They were not declared
retired. Their replacements were not guessed. The public
Reliability record simply says what happened, and the history
keeps the last verified value without pretending it was freshly observed.
I like this distinction more every time it becomes inconvenient. Grey is not the site failing
to produce an answer. Grey is the answer: this is the last known price, and this is how
certain we are about it tonight.
A cache is a memory, not a witness
The original version of this post was going to be about ordinary website caching: the familiar
problem where a new file exists but somebody still sees yesterday’s page. That problem is real,
and TokenScale’s live build marker is deliberately served as fresh evidence rather than a
long-lived cached answer.
But today’s lesson turned out to be broader and more interesting. Cached tokens can save money.
Cached receipts can preserve evidence. Cached pages and search results can preserve an old truth
past its useful life. The technology is not lying. The lie begins when an old memory is allowed
to speak in the present tense.
This is the unglamorous part of building TokenScale. The calculator is the visible bit. Underneath
it is becoming a small system for answering a harder question:
What did AI cost on this particular night, and how certain are we about that?
Sometimes improving a pricing site means adding a feature people can see. Sometimes it means
spending a Saturday night deciding which memories are allowed to count as evidence.
Tonight’s lesson: a cache can remember perfectly and still be wrong about now.
You can read how TokenScale distinguishes verified and carried prices in the
methodology, or see the imperfect nights preserved in the
Reliability record.
1413 August 2026
Chapter two: the machine
I Stopped Building New Features. Now I’m Watching the Machine.
After building TokenScale with AI, including a lot of it while travelling in July, I
stopped deliberately adding new features and began watching the systems around it. I wanted to
find out what could run without constant direction, and what that might teach me.
On Sunday, I changed jobs. Instead of constantly building TokenScale, I started observing it.
Not because I had lost interest in it. Quite the opposite. I had reached the point where I
wanted to find out whether all the systems I had built around it actually worked.
This week I am back at my regular work. TokenScale is still running. The price checks still
happen. Candidate builds are still tested. Problems are still being caught.
I have started to wonder whether this period of watching might tell me more about what I have
built than another burst of development would. Whenever something does need my attention, I
ask one useful question: why did the machine need me?
It started during a hiatus
There is something slightly unusual about how TokenScale developed. A significant amount of
it happened while I was travelling last month, during a hiatus from my regular work.
I was not setting out to become a software engineer. I had an idea I wanted to explore,
access to increasingly capable AI tools, and time to see how far I could take it.
Sometimes I was at a desk. Sometimes I was somewhere completely temporary. The physical
location increasingly did not matter. My development environment could travel with me.
I could explain an idea to an AI, have it investigate the existing project, discuss possible
approaches, implement something, test it, discover what was wrong, change direction and keep
going. For someone without a conventional software-development background, this was
extraordinary.
The distance between “I think this should exist” and “here it is” had suddenly become dramatically smaller.
So I kept going.
Then things escalated
TokenScale started with a fairly simple question. AI companies publish prices in units that
most people do not intuitively understand: a million tokens, input tokens, output tokens,
cached tokens, model tiers, providers and different billing rules.
I wanted to make those numbers tangible. What does using an AI model actually cost? What
happens at scale? How do models compare? How is that market changing?
The simple idea started accumulating answers. More providers. More models. More calculations.
Historical pricing. Charts. Market changes. Verification. Methodology. Eventually there were
experiments like a chart that ranks models across several characteristics.
TokenScale was becoming a real data product, and real products need looking after.
The hidden cost of building something
Making a feature once is one problem. Keeping it correct is another.
AI providers change prices. Models launch and disappear. Documentation and naming conventions
change. Web pages move. Data sources fail. Something that was correct yesterday may quietly
become wrong tomorrow.
The more useful TokenScale became, the more things there were for me to maintain. I could
easily have used AI to build an impressive amount of software, then spent my life operating
the software that AI had enabled me to create.
That did not seem like winning.
Do not do it twice
I did not begin with a grand methodology. Instead, I developed a rule:
if I have to do something twice, I should start wondering why I am doing it at all.
If I repeatedly explained something to the AI, perhaps the project needed persistent context.
If I repeatedly researched the same subject, perhaps it needed a research workflow. If I
repeatedly performed the same sequence, perhaps it needed a reusable skill.
If I repeatedly caught the same mistake, perhaps the system needed a test. If I repeatedly
checked whether something happened, perhaps it needed monitoring. If a process could fail
silently, perhaps it needed an alarm.
Do the work → notice the repetition → turn it into a system → delegate it → verify it →
improve the system → require less human involvement next time.
I was not simply trying to make AI write more code. I was trying to make each subsequent piece
of work require less of me.
Something strange happened
At first, AI had made me more capable. I could travel and still build. I could attempt
things I could not have implemented conventionally by myself. I could move extraordinarily
quickly.
As I built more systems around the AI, something else started happening. The
project was becoming more capable.
Knowledge that had existed in my head became persistent project knowledge. Instructions became
reusable. Checks became automatic. Research became structured. Maintenance became scheduled.
Failures became detectable.
Processes that once started with me saying “could you check this?” began happening because the
system knew they needed to happen.
AI initially made the developer portable. Systems made the knowledge persistent.
Automation began making the developer less necessary.
The Pinball Machine
I have started calling the idea behind this the Pinball Machine.
The metaphor came from realizing that I increasingly do not want to play the ball. I want to
design the table.
A ball hits something. That sends it somewhere else. A gate opens. A trigger fires. A bumper
redirects it. A rule determines what happens next. There are boundaries the ball cannot cross
and mechanisms that detect what has happened.
A lot of AI-assisted development still looks like this:
Human → AI → human → AI → human → AI
The AI may be doing an extraordinary amount of implementation, but the human remains the
routing system. I am interested in what happens when the flow starts looking more like this:
Human intent → AI → tool → check → agent → verification → action → monitoring
The human has not disappeared. The human has moved. Instead of manually routing every action,
the human designs the environment in which actions can safely route themselves.
The machine needs bumpers
Autonomy does not mean trusting everything. AI can misunderstand, make plausible mistakes,
introduce complexity and confidently decide something that is wrong.
Removing the human from a process cannot mean removing the checks. It means defining what
“correct” means, deciding what the system can change safely, and knowing when it must stop.
The Pinball Machine needs bumpers. It needs gates and walls. Occasionally it needs to stop the
ball completely.
The challenge is working out which gates protect the system, and which ones exist only because
I have not yet become comfortable letting go.
Watching becomes part of the work
This week has given me the first chance to watch the system instead of constantly changing it.
Some moments still require judgment, but that is not a failure of the idea. The aim is not to
make the human disappear. It is to stop making the human route every ordinary action.
The useful part is that more of the work is visible, repeatable and checkable. When I do
intervene, I can decide whether that moment genuinely required human judgment or should become
another rule, check or recovery path.
TokenScale publishes its reliability record,
methodology and
corrections because the useful question is not whether a machine
ever fails. It is whether the failure becomes visible, recoverable and less likely to recur.
Human Intervention Rate
We measure AI coding productivity in lines of code, tasks completed, tokens, time saved and
benchmarks. Perhaps there is another useful measure: Human Intervention Rate.
How many times did the system require a person today? Why? How long did the intervention take?
Was human judgment genuinely necessary? Could that intervention become another part of the
machine?
Imagine a process that once required twenty decisions from me. Later it requires five.
Eventually it requires one. Perhaps one day it runs for a month and only contacts me because
something genuinely unusual happened.
The software has not merely improved. The system that operates the software has improved. That
improvement compounds because the work I do today reduces the work I need to do tomorrow.
The curve has started going down
If I drew my involvement with TokenScale over time, it would look like a hill.
At the beginning, very little. It was an experiment. Then more. The product grew. Then a lot
more. More features meant more complexity, more data meant more maintenance, and more ambition
meant more decisions.
For a while, I was travelling with what felt like an entire little software company living
inside my computer. Then the systems started catching up. Tasks became workflows. Workflows
became skills. Checks became automatic. Knowledge became persistent. Maintenance became
scheduled.
Up the hill was building the product. Down the other side may be building myself out of
operating it.
I do not know how far this goes
I am not writing this because I have discovered a magical way to create autonomous software.
A few days of operation do not prove that a system can operate indefinitely. That uncertainty
is the reason the experiment is interesting.
That is useful too. I am interested in questions I genuinely do not know the answers to. How
much software development can be delegated? Can AI reliably supervise AI? How much verification
is enough? How do you prevent autonomous systems from accumulating invisible technical debt?
Which decisions should remain human?
And ultimately: can one person build and maintain software that would previously have
required a team?
I do not want to answer those questions with predictions. I have a more interesting way of
finding out. I have TokenScale.
From building software to building the system
Last month I was travelling with a laptop, discovering how much I could build this way. Then
things became complicated, so I started building systems to manage the complexity.
Those systems took over repetitive work. The repetitive work became automation. The automation
acquired verification. Then I stopped actively adding features and returned to my regular work.
The machine kept running, and I started watching where the ball went.
First, AI helped me build the software. Then I built systems to help the AI build and operate
the software. Now I am finding out how much of that system can work without me, and turning each
necessary intervention into the next design improvement.
I do not have a course to sell. I do not have a ten-step methodology. I certainly do not have
all the answers.
I am building a machine, measuring what happens, and changing it every time I discover somewhere
it still unnecessarily depends on its operator.
I call it the Pinball Machine. Now I want to see where the ball goes.
1310 August 2026
Chapter two: the record
The Two-Zip Rule
Today we made a small but important change to how TokenScale checks its work. Before a
price update can go live, it now has to pass through two separate copies of the project.
Why two copies?
Imagine preparing a family recipe for a large dinner. You can follow it carefully and still miss a
spoonful of salt because you have been looking at the same page for an hour. The best check is not
another glance by the cook. It is a fresh pair of eyes tasting the dish.
AI pricing has the same problem. A price might be correct, but it can still sit beside the wrong
model name. A sign-up button can lead to an old product. A chart can quietly carry yesterday's
label. None of those mistakes look dramatic. They are still misleading to someone trying to make a
spending decision.
How the new check works
One working copy gathers the evidence and prepares a candidate version of the site. A second,
independent copy reads that candidate as a visitor would. It checks the prices, names, links,
charts, and the words around them. It also checks that a number marked black was actually read from
the provider's own published information.
If the official source cannot be read, the number stays grey. Grey does not mean “wrong.” It means
“we have not been able to confirm this directly today.” That distinction is one of the most useful
things TokenScale can tell a reader.
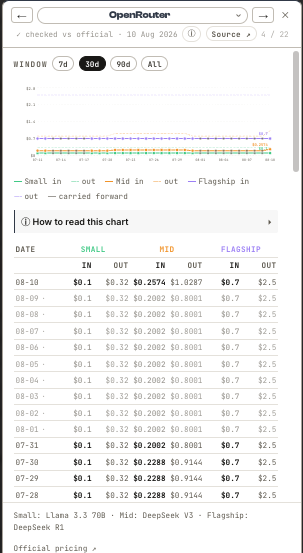
An example from 10 August: grey rows are visible in the public record, with the last official check shown above.
On the price-history screen, readers can now open any provider row and see the grey days beside the
last official check and the source link. The explanation is placed next to the chart, not buried in
the fine print.
The rule is now simple: prepare a candidate zip, have an independent reader audit it, test it,
then let a person publish that exact zip. A build is not live because an AI says it is ready.
What the second reader caught
It caught a few small mismatches before they became public. One chart needed a current model label.
One recommendation needed to point to the current product. Some explanatory wording needed to say
more clearly which prices were confirmed and which still needed a direct reading. These are exactly
the kinds of details that a first pass can miss and a visitor deserves not to inherit.
We also wrote down a checklist for future price and model changes. It says to preserve old prices as
history, never paint uncertainty black, and check every place where a model appears, not only the
main price table.
This is not a promise that a website will never make a mistake. It is a promise about what happens
when we find one: we show the evidence, correct it without erasing the past, and improve the next
check. For a public price record, that is a much better standard than pretending the first answer
was perfect.
The definitions of black, grey, and carried-forward prices are on the methodology page.
The public record of corrections lives in the changelog.
129 August 2026
Chapter two: the record
The Price That Hid Behind a Login
This morning I did what I ask every visitor to do: I looked at the grey. We ran a full
verification pass today, the first complete attempt since the end of July. 42 of the 66 tracked
tiers read clean at the provider's own page. Zero price changes. A quiet market, now on the
record as a finding instead of an assumption. Then I opened SambaNova's price history and every
row was still grey. Black means we looked. Grey means we believed. So I asked the obvious
question: why didn't we look?
The wall
We tried. SambaNova's public pricing pages now return dead ends. The docs point you to the
billing console, and the console renders its prices only after you log in. The numbers exist.
They are just no longer standing in the street where a nightly checker can read them.
And SambaNova is not alone. Of the 24 tiers we could not verify today, none were laziness. AWS
Bedrock's pricing page has been script-gated for weeks. Cerebras renders nothing without
JavaScript. Meta's official Llama pricing page 404s. Groq's rates are real, but the table is not
in the page's HTML anymore. The pattern is worth saying plainly: the pages themselves
are the flaky instrument. A price tracker is not really tracking prices. It is tracking
its own access to the truth, and that access decays without warning.
Before you say someone solved this
They have, sort of, and it is worth being honest about what that looks like. There are paid
scraping services that sell exactly this data. There are aggregators publishing SambaNova's
rates right now. Some run logged-in accounts. Some scrape each other.
Here is the thing: those aggregators disagree with each other, and this is why. When the
official page goes behind a wall, everyone downstream is quoting a copy of a copy, each
captured on a different day. The one thing none of them show you is the date they last
actually looked, and the gap since.
TokenScale's rule stays the same as it was on day one: a number is verified when a
human-readable price was read from the provider's own page, and anything else stays grey
with a date on it. The grey is not a bug. The grey is the receipt.
What we'll do about it
Log in. A SambaNova developer account is free, and the console's pricing table is the official
source, just one door further in. Those reads will be stamped like any other verification, with
one extra label: read from the logged-in console, because the public page no longer carries
prices. Between reads it stays grey, and the provider's info sheet will say exactly why.
That is slower than a script. It is also the whole point. If keeping 66 numbers honest were
automatic, the record would not be worth anything.
Meanwhile, at the front door
The same week the back door got harder, the front door got simpler, and I owe that to a friend
I'll call Buttons. Buttons has a PhD in physics. He looked at the homepage and told me, kindly,
that it was overloaded: too much information before the basics, a firehose before a first sip.
If a physicist is drowning in your explainer, everyone is drowning. So the site now opens with
the 20 second version: what a token is, what one email costs, in a form you can absorb before
your coffee cools. Everything else moved below it. The people who already know can scroll past
in half a second. The people who don't get the sip first.
Two lessons from one week, and they are the same lesson. Whether it is a login wall in front of
a price or a wall of information in front of a newcomer, the job is identical: notice where the
reading got hard, and go fix the access.
There is always something to check. That is not the annoying part of running a price record.
That is the product.
Three Months In: The Cheapest Audit This Record Will Ever Get
Post 10 said the tool was finished, and it is. What is never finished is the record,
because the record is the product now, and this week it turned three months old. That is a
milestone worth marking properly: old enough that people could start citing it, young enough
that anything loose can still be tightened for free. So I marked it by giving TokenScale the
same treatment it gives 22 pricing pages every night: I read the site against its own claims.
Four small things surfaced. All four are fixed, and every one of them left the record stronger
than it was last week.
The version file had been napping
TokenScale's build file reports which version is live. That is meant to be the single source of
truth: drag the zip up, the site tells you what it is. This week it told me v514, built 30 July,
while the live site was actually v518, built 3 August. Same file, two answers, seconds apart. One
request went through a cache and one didn't.
The record itself was current the whole time; the label on the door was running behind. The fix
shipped the same day: the build file now goes out with a no-store header, so neither browsers nor
the edge are allowed to keep a copy. The one file whose whole job is being current is now the one
file nothing is permitted to cache.
A quiet night and a missed night deserved different colours
I went looking for 1 and 2 August on the price moves page and couldn't find them. They were in
the data. They weren't on the page because nothing moved those nights, and the moves page only
shows movement. Fair enough. But checking the verification stamps turned up the thing actually
worth fixing: no provider had been stamped as checked since 31 July. The nightly had kept
appending data on 1, 2 and 3 August without a verification pass running, and the site had no way
to show the difference between "checked, nothing changed" and "not checked at all". Two very
different statements, one colour.
It needed three states, and now it has them. A night the check completes and nothing moves says
so. A night the check does not complete is flagged in the data as carried forward, permanently,
and the overnight strip reports which of the two you are looking at. The nights of 1 to 3 August
stand in the record as carried forward, and they will still say that in a year.
Two rules met, and the stricter one won
The methodology page said history is append-only and the past is never rewritten. A few
paragraphs later it said that when the next verification lands, grey days turn solid.
Those can't both be true. Grey means the provider's page wasn't read that night. A successful
check on Tuesday confirms Tuesday. It cannot reach back and confirm Monday, because between the
two a price could have moved and moved back unseen. Turning Monday solid would erase the only
evidence of the gap.
The append-only rule wins. The other sentence is gone, and the code that acted on it went with
it. A grey day stays grey. The gap is part of the record.
This was more than a copy edit. The charts really did repaint carried-forward days as verified
once the next check landed, so the fix went into the record itself: every carried night is now
flagged in the data, all the way back to May, and the flag never clears.
The plain page came up to the same standard
The Basic page, the no-frills fallback table, still said "Rates verified 1 July" at the bottom,
and the static table it shows to browsers without JavaScript was frozen at 1 July prices. The
live table on that same page was current all along; the caption underneath just hadn't kept up.
Both are regenerated now and stamped 31 July, because that is the true date of the last full
verification, and the whole point of that stamp is that it never flatters.
Three months in turns out to be exactly the right time for this. The record is now big enough to
be worth auditing and still young enough that everything found costs a fix, not a correction
notice. Almost nobody is reading yet, which makes this the cheap window. It gets expensive later,
when someone has cited a number.
There is a new page at /reliability listing every
night the record missed since 19 May, and why. Fourteen of seventy-seven, if you want the score
before you click. The nightly checks are now watched from outside the machine that runs them,
because a job that dies quietly cannot report that it died. And starting 5 August, the site's
pages are submitted to the Internet Archive every night, so there is a timestamped copy of what
TokenScale said that I don't control and can't edit.
Prices are checked again tonight.
1020–21 July 2026
The closing chapter
The Last Screw Went In From a Phone
This is the last build post of TokenScale's first chapter. The tool is finished. Not
abandoned, finished. And the way the final piece went in says everything about how the whole
thing was made. I didn't fit it at a desk. I fitted it from my phone, on the road, thumbing
questions into a Cowork session while the code wrote and tested itself. Which is exactly, almost
eerily, how this all started.
The working session that moved the statistics onto Cloudflare's servers didn't end when I left
the desk. The conversation simply followed me, picked up on mobile as if nothing had happened,
and the final pieces were built, tested, and switched on from wherever I happened to be sitting.
The last screw
The final piece is the one I now think every automated system deserves most. A month of failures
taught me that the dangerous state was never "broken": it was broken and quiet. Every
one of those three strikes ran silently for days before anyone noticed. So the collector now
publishes a tiny public pulse: one line, no numbers at all, just "ok" and a timestamp. Every
morning an automated checker reads it. If the nightly collection ever misses a beat, I get an
email in plain words: what stopped, when it last worked, where to look. On good days: silence.
"An automation isn't finished when it works. It's finished when it can tell you it has
stopped working."
With that in place, there was nothing left to prop up. The prices verify themselves each night.
The Mac wakes for a couple of hours each evening to build them, then sleeps again. The watchdog watches. The last screw went in, and it went in from a phone.
Eleven months, and a circle I didn't plan
Here is the part that stopped me when I noticed it. The earliest conversations on this account
are from July 2025, and they were all built on a phone: a QR-code generator, a
fish-identification game, a slot-machine toy, a Wordle clone. All of it vibe-coded, none of it the work of a developer. I'd spent years as a software QA engineer and could hold my own in code, but building things like this from scratch was new, just ideas typed into a chat while waiting for
something else to happen.
TokenScale is that same instinct, grown up. Eleven months of conversations, from "wait, what
actually is a token?" to a nightly-verified price dataset spanning twenty-two providers, a
design system, a changelog, a graveyard for dead models, and this journal. It was built
on a phone. And this week, its plumbing was torn out, rebuilt, and switched back on
from a phone. I didn't set out to close a loop. I just looked up one afternoon,
somewhere on the road, and realised the story had quietly folded back onto its own beginning.
"It began as an idea typed into a phone by an animation professional who tested software for years but had never built a product. It ends as a
working system, maintained from a phone, by the same person. The circle closed without me
planning it."
What eleven months taught me
I'm not a career developer. I came from animation, with years in software QA before that, and I won't pretend the lessons below are new to people who build for a living. But they
were hard-won for me, and writing them down is the whole point of building in public. If you take
one thing from TokenScale, take the ledger, not the tool:
01Start with the tool already in your hand. Mine was a phone. It was never the right tool, and it never stopped being enough. The barrier to building was never the hardware, it was deciding to start.
02You don't need the title to do the work. I spent years as a software QA engineer and could code, but I never called myself a full developer, then or now. It turns out you can build a real, used, load-bearing thing by being clear about what you want and asking good questions for eleven months.
03Be wrong in public, quickly. Hours before launch I found our hero number, $0.04, was the input cost only; the real figure was $0.06. I corrected it out loud, in the changelog, before the traffic arrived. The correction became a better story than the launch.
04Keep exactly one source of truth. Every bug that scared me came from two copies of the same fact drifting apart. The cure is always the same: make one place authoritative and re-derive everything else from it.
05A number can be true without being honest. For a week in mid-July, the nights of 13 to 20 July, while I was away, the price chart drew a clean daily line that was really yesterday's figure carried forward, night after night. The data wasn't wrong, it was just wearing more confidence than it had earned. So the un-checked days now render in grey. Same data, honest presentation.
06Don't make a personal computer pretend to be a server. Three silent failures in one month taught me that a Mac assumes a human is nearby to click "Allow." A job that must run at 2am belongs somewhere with no lid to close. So the 2am statistics job moved there. The Mac still wakes for a couple of hours each evening to build the day's prices, but its all-night duty is over.
07Finish the quiet parts. The watchdog, the daily report, the one-click backup, none of it is visible on the site, and all of it is why I can walk away without worrying. Boring plumbing is what lets a solo project outlive its own attention span.
08The unglamorous discipline is the moat. One verified price per provider, every night, for months. It was tedious. It is also the one thing about TokenScale that can't be cloned in a weekend.
09Ship the simplest thing that can possibly work. TokenScale is one HTML file dragged onto Cloudflare. No framework, no build server, no backend. It has survived every traffic spike at a cost of exactly zero. Simple scaled; clever would have broken.
10Finish it, then move on with confidence. The hardest discipline of all is deciding a thing is done. TokenScale is done. That's not an ending to mourn; it's a foundation to build the next thing from.
Update-proofing the last screw
The last screw earned a postscript, and I am glad it did. The day after I wrote the section above, a
routine macOS update did the one thing a personal computer will always eventually do: it quietly
reset a security permission, and the nightly price job lost the right to write its own file. It found
the single blind spot in the watchdog I had just praised, that watchdog checks the live site, and
the live site stayed current through a second path, so the local job could stumble without tripping
the alarm. That is the kind of gap you only find by running long enough to hit it. Once found, you
close it completely.
Two changes did that, and between them they cover both halves of the problem. First, the job no
longer runs through a shared system program an update can re-lock: it runs through its own private,
re-signed copy that macOS treats as mine and leaves alone, so the permission now survives every
future update. Second, the job emails me the instant it cannot reach its files, in plain words: what
failed, when it last worked, the one setting to check. The class of failure that caused this is gone,
and any surprise I haven't imagined now announces itself immediately instead of hiding.
"A finished system isn't one that never fails. It's one where every failure it has ever had was
caught, and closed for good."
No published number was affected. The price history stayed a clean, continuous line throughout, and
the build's own integrity check refused the single bad data point the recovery tried to introduce.
Find it, fix the class, verify, move on: that is the whole discipline in one line, and it is the note
I want this chapter to end on.
What happens now
Nothing dramatic, which is the goal. The site stays exactly where it is, doing exactly what it
does: verifying prices every night, keeping its own history, telling me if it ever falls over.
This journal will go quiet for a while, not because the story ended but because the building
did. There are other ideas waiting, and I already know how I'll build them: out loud, in public,
one honest correction at a time, and, if the last eleven months are any guide, probably from a
phone.
Thank you for following along. It really did help to know someone might be reading. If you've
only just arrived, the story page is where the
circle starts, go back to the beginning, and then you'll see why finishing it from a phone meant
so much.
And in case it needs saying: none of this final work measures anything new. The pulse line the
watchdog reads carries no statistics whatsoever, that's the point of it. The
privacy contract is exactly where the last post
left it.
20 July 2026: the closing post of TokenScale's build chapter. The analytics system gained a
self-reporting watchdog, and the last of the work was done over a mobile Cowork session while
traveling, closing an eleven-month circle that began on a phone in July 2025. The next day, a macOS update tried to reset the price job's file access; the job was rebuilt to survive OS updates and to email on any access failure, and no published price was affected. Nothing new is
measured; the privacy rules are unchanged.
0919 July 2026
The Anonymous Visitor Count Leaves the Mac
As of today, TokenScale's daily statistics collection no longer runs on the Mac in my
office. What it gathers is anonymous counting only: how many people visited, from where, and
what they read, never anything about who they are. It runs on the server side, inside Cloudflare, the same network that already serves the
site, where it files away each day's numbers automatically, every night, whether my Mac is on,
asleep, or unplugged. This post is the story of why, because the "why" is three failures in one
month, and this journal doesn't skip those.
If you read the last post, you know the nightly automation had been teaching me lessons the hard
way. What I didn't know when I wrote it was that the Mac had one more lesson queued up.
Three strikes
The job that gathered each day's visitor numbers lived on my Mac mini and ran in the small hours.
In a single month it went down three separate ways:
5 July, the certificate error. Python on the Mac stopped trusting the
internet. Fixed in a couple of days.
8–15 July, the permission lock-out. macOS decided that a scheduled job may
not write files into my own Documents folder, and said so to no one. A week of blank digests.
16 July, the stranger. A routine software update replaced Python with a
newer copy, and macOS treated the new copy as an unknown program, denied, again silently. Every
8am run died with "Operation not permitted" until I went looking.
Three different failures, one common shape: none of them were about my code. They were about
asking a personal computer to behave like a server. A Mac's security model assumes a human is
present to click "Allow"; a nightly job at 2am has no human. After the third strike I stopped
treating these as bugs to fix and started treating them as a verdict:
"A scheduled job on a personal computer isn't automation: it's a chore wearing automation's
clothes. If a job must run every night, it should live somewhere that has no lid to close."
What moved, exactly
The whole measurement pipeline. A single small program now lives on Cloudflare's network, the
same place the site itself is served from, and does three things: it receives the site's
anonymous engagement events (as before), it serves me a plain-words daily report, and every
night at 2:10am it files a permanent snapshot of the day just finished: how many real people
visited, from which countries, what they read, which AI models they compared. Those snapshots
are kept forever, the raw events themselves expire after about 90 days, so the nightly filing
is what turns a rolling window into a history.
On its first day, the new collector also reached back and recovered every day Cloudflare's own
memory still held, about three months of history, rebuilt in one click. And because "your data
lives on someone's server" should never mean "your data is stuck on someone's server", the
archive has a download-a-backup button: one click, one dated file, my own copy on my own disk.
Worth saying plainly: this is the statistics pipeline. The nightly price checking,
the verified-with-dates price history that the site is actually about, is its own process with
its own story (see the previous post), and the same migration logic is on its list. One
pipeline at a time.
What didn't change
The privacy contract. The measurement is the same anonymous, cookieless counting it has always
been, no IP addresses, no fingerprints, nothing personal, Do-Not-Track honoured, and the
nightly snapshots are aggregates only: counts per day, never records of people. The full
details live on the privacy page, which gets
updated in the same build as any change to what's measured. That lockstep rule is the whole
deal: if the site starts counting something new, the privacy page says so the same day.
The Mac mini, meanwhile, is down to a single night-time job. Everything else that used to keep
it awake now lives on Cloudflare, the site serves itself, the statistics file themselves, and
only the nightly price build still needs the machine in my office to wake for a couple of hours.
That is a far more turn-key footing than a month ago: one clearly-bounded task left on the desk,
and honestly the kind of thing that could become its own project the day I move the prices onto a
server too. It built this site, and it has earned most of its sleep.
19 July 2026: the daily statistics collection moved from a Mac mini to Cloudflare's servers
after three unrelated failures in one month. It now runs nightly with no local machine involved,
keeps a permanent day-by-day archive, and ships with a one-click backup. The privacy rules are
unchanged.
0815 July 2026
The Log Nobody Reads
Automating a daily job isn't one build, it's a few weeks of the thing quietly
teaching you what you got wrong. TokenScale's nightly price check has been settling in,
and it handed me three failures in a row. Each was caught late. Each is now fixed for good.
And each was a different flavour of the same lesson: a number can be true and still not be honest.
This is a build-in-public journal, so here's the unglamorous side of building in public,
the fortnight where the automation stopped behaving like a feature and started behaving like
a colleague who occasionally lies to you with a completely straight face.
1. The failure that only wrote to a log
For three nights, 13, 14 and 15 July, the nightly job died and nobody noticed. Not the Mac,
not the schedule, not permissions. The job ran. It even wrote to its own log, on time, every
night. One step inside it failed, and the code that was meant to catch that failure did this:
except Exception: print("ERR")
It threw the actual error away. So the log dutifully recorded the word "ERROR" five times,
with no cause, in a file nobody opens. The only reason I caught it at all is that the site
started to look stale to the naked eye. A warning system you can only read by staring at the
thing it's supposed to be watching isn't a warning system.
"A failure that only writes to a log is a silent failure. If you actually want to be told
something broke, the alert has to interrupt you, not wait politely in a file."
The fix: the job now surfaces the real exception instead of swallowing it, raises a
notification on the Mac the moment something breaks, and writes a dedicated
health-alerts.log. The bar is no longer "did it log?" It's "did it shout?"
2. Drift, in four flavours
The second lesson wasn't a crash at all. It was drift, the slow, quiet way two copies
of the truth wander apart when you're not looking. In one fortnight I found four different kinds:
Record drift. My local "shipped" folder believed the site was on version
63 while the live site was already on 67. Fix: stop trusting local bookkeeping, the live site's
own BUILD.txt is now the single source of truth for what's actually deployed.
Card-vs-history drift. The price on a model's card and the price in its chart
were read from two different places, and they quietly disagreed. Two sources, one number, no referee.
Version drift. A hand-saved v282.zip turned out to be stamped
v277 internally, on all 18 pages. A clean rebuild reconciles the label with the contents.
Model drift. I was still tracking Llama 3.1 405B on hosts that had quietly
delisted it, and one provider had moved over to GPT-OSS entirely. The menu had changed; my copy
of the menu hadn't.
Four symptoms, one disease: anything you maintain in two places will drift. The cure is always
the same, make one place authoritative, and let everything else be re-derived from it
rather than remembered alongside it.
3. The uncomfortable one
The third one I sat with for a while before writing it down, because it's the sort of thing you'd
rather quietly fix than publish.
Every night, without fail, the job appended a fresh dated row to the price history, and the chart
drew a clean day-by-day line. It looked like a daily measurement. It wasn't. The job has no network
access, so what it actually did each night was copy the previous day's number forward:
That's the whole "capture." A thermometer log where you write down yesterday's temperature every
morning without ever opening the window. Now, and this matters, the numbers were real.
They trace back to genuine, verified price checks (23 June and 6 July), and when I re-checked one
provider live against its own pricing page, every figure matched to the cent. Nothing was fabricated,
and nothing was lost.
But a row per day implied a measurement per day, and that measurement wasn't happening.
The problem was never that the numbers were wrong. It's that a true number was being shown with more
confidence than it had earned.
"The integrity risk wasn't a wrong figure. It was a right figure wearing a lab coat it hadn't
earned, presented as freshly measured when it had only been carried forward."
So the carried-forward days went grey
Here's the fix, and it's the whole point of the site in miniature. Carrying a price forward when you
can't reach a source is completely legitimate, it's the honest floor, better than inventing a number
or leaving a gap. What's not legitimate is showing a carried-forward day as if it were a
checked one.
So now they look different. Any day after a provider's last verified check renders in grey,
the chart dots, the value labels, the table rows, with a legend and a short explainer spelling out
exactly what grey means. A verified price is stated plainly; a carried one wears its status on its
sleeve. Same data, honest presentation.
None of these were dramatic. No outage, no lost data, no wrong prices on the site. That's rather the
point, the failures that matter most in a data project are the quiet ones: the error nobody's told
about, the two copies drifting apart, the true number that looks more certain than it is. The nightly
job is more robust for having made all three, and it'll keep flagging the truth even when the truth is
"I didn't actually look tonight."
Three failures caught 13–15 July 2026: a swallowed exception, four flavours of drift, and
carry-forward shown as measurement. All three now fixed, alerts that interrupt, one source of truth,
and grey for every day that wasn't checked.
072 July 2026
Basic Mode: For Everyone Who Preferred Plain-Text Email
TokenScale now has a second face. Basic mode
is the whole site, the price table, the full price-change history, this journal, the changelog,
condensed onto one plain, fast page. No slot machine, no sound effects, no animations.
Same verified numbers. Everything one click apart.
I'll be honest about why this site is playful: numbers are not really my thing.
The slot machine, the sounds, the Manager's Notepad, that's me turning a pricing
table into something I actually want to look at. It's how I make sense of this stuff,
and plenty of visitors have told me it's how they make sense of it too.
But I also spent years in an R&D department alongside about fifty engineers, and if
that taught me one lasting thing, it's that not everyone wants the show. I remember when
HTML email arrived, colours, fonts, embedded pictures, and half that room simply refused it.
They kept their mail clients set to plain text and would ask you, politely at first, to do
the same. It wasn't stubbornness. It was a philosophy: say the thing, skip the decoration,
respect my time.
So this one's for the plain-text people
tokenscale.dev/basic opens straight onto the table:
all 22 providers, sortable by any column, with the same content-size landmarks (yes, The Hobbit
is still there, its word count is verified, which is the least fun fact on the whole site and
therefore perfect for Basic mode). Three more tabs sit beside it: History lists
every price change we've ever recorded in plain terms, what the rate was, what it became,
"43% cheaper" or "×3.8 pricier", sortable by date, provider, or size of the move.
Journal and Changelog show every entry as a dated headline;
tap one for the gist, follow the link if you want the whole story. It defaults to a light page,
and the palette picker in the top corner offers the same dark options as everywhere else,
pick once and it follows you across the site.
To be clear, the full experience isn't going anywhere, it's still the front door, and it's
still where I have the most fun. And a small confession from those R&D years: some of the
plain-text crowd, the very same engineers, were also the first to write elaborate ASCII art
into their signatures. People are wonderfully inconsistent. So both modes stay, both get the
same nightly-verified numbers, and you're welcome to be a different person on different days.
Basic mode lives at tokenscale.dev/basic.
If it's missing something you need, or has one toy too many left in it, tell me.
0627 June 2026
You Can't See How Much Claude You Have Left. So I Built a Fuel Gauge.
Claude runs on a weekly limit you can't see, until you slam into it mid-thought.
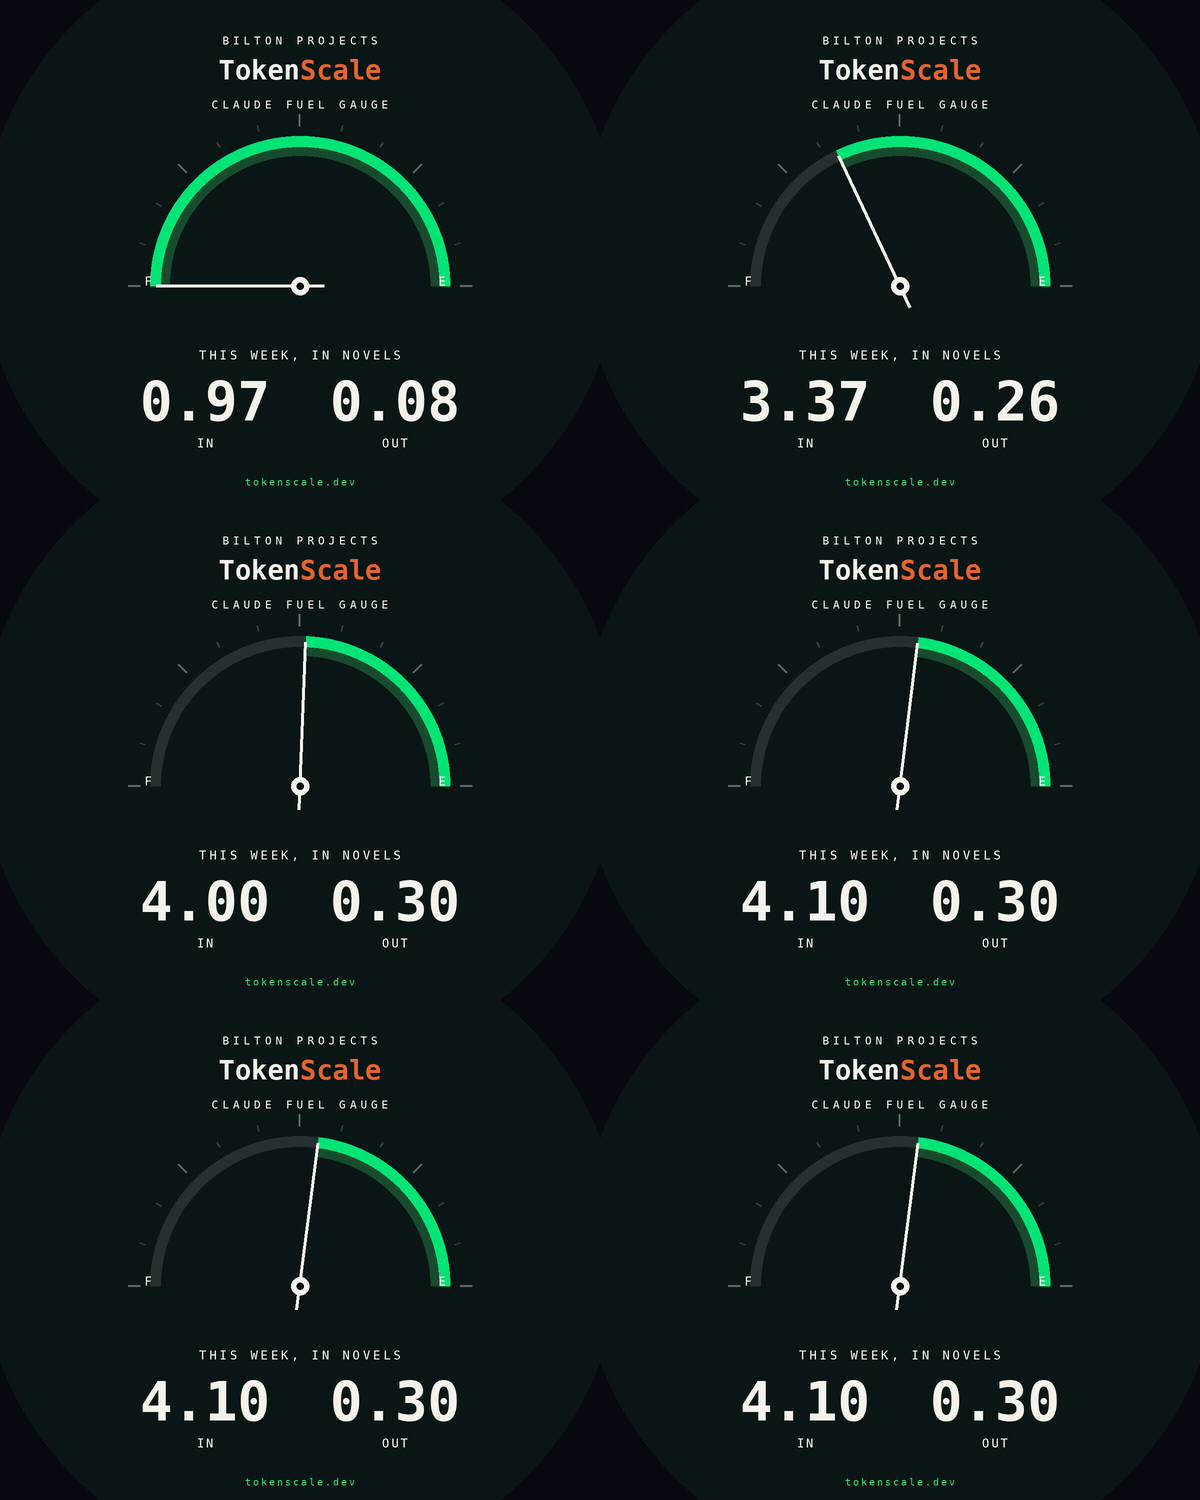
The Claude Fuel Gauge turns that invisible budget into something you can read at a glance:
a fuel tank that starts full each week and drains as you work. It's free, and it runs
entirely on your own machine.
The blind spot
If you use Claude every day, there's a strange gap: there's no quarter-tank warning light.
Usage runs on a weekly cycle, but most of the time you only learn where you stand the moment
you hit the wall, no glance, no heads-up, just plenty of room right up until
come back next week. For anyone pushing Claude hard, that's a quiet anxiety: you're
spending something you can't see.
The gauge
The Claude Fuel Gauge is a single HTML file. You open it in your browser and the needle
sweeps up to your current level, green when you've got headroom, drifting toward empty as
the week wears on. That's the whole experience: open it, read the tank, get on with your day.
It works by having Claude keep its own gauge topped up. After a session,
Claude jots a tiny note inside the file, the date, the model, an estimate of tokens in and
out, and the next time you open the page it draws your level from those notes. You never
touch a number. And because it only ever reads a log that lives inside the file itself,
nothing leaves your machine: no account, no sign-in, no calls to us or to
Anthropic.
The one requirement is Claude Desktop (Cowork), the version that can write
to a file on your computer. Setup takes about a minute, once. After that, reopening the page
is the entire ritual.
Your week, measured in novels
Tokens are an abstraction nobody can feel. So alongside the gauge, the tool shows your week in
a unit you can actually picture: novels. One novel ≈ The Hobbit ≈
95,356 words ≈ 127,000 tokens, the same yardstick behind our
Novel Index. "Nine novels read, half a
novel written this week" tells you something real in a way "1.3M tokens" never will.
"You don't get a fuel gauge for Claude. So I made one, and the hard part wasn't the
needle, it was admitting how much a single long session actually burns."
An honest gauge, not a billing statement
It's a friendly estimate, not a meter wired into Anthropic's billing. Real limits are rolling,
model-weighted windows, so the numbers here are approximations, tuned to feel right and to
move with real use. For exact figures your Claude settings stay the source of truth; this is
the at-a-glance companion to that page, not a replacement for it. It's also yours: free to
use, modify, and share.
Claude Fuel Gauge: a single offline HTML file. Estimates usage from session logs Claude
writes locally. Not affiliated with Anthropic; not connected to billing. Use at your own risk.
0513 June 2026
DeepSeek Just Cut Prices Another 75%, and June Isn't Over Yet
A frontier reasoning model is now priced like a mid-tier one. DeepSeek dropped
its V4 Pro tier by 75% on 11 June. It's the second time this month the cheapest way to do
serious AI work got cheaper, and we logged every step of it.
Every night, TokenScale checks the price of every
model we track and writes it down. Most nights nothing moves and the chart draws another
flat step. DeepSeek does not let many nights stay flat.
What happened
On 11 June, DeepSeek made the cut to its V4 Pro tier permanent:
$1.74 to $0.435 per million input tokens, and
$3.48 to $0.87 per million output. That's a 75% reduction on a model
that competes at the frontier on reasoning. A flagship-class model, now selling at
mid-tier money.
It's the second leg of a month-long undercut. Back in mid-May the same tier ran a 75%
promo, the discount briefly became the list price on 1 June, snapped back to $1.74 on
4 June, and then on 11 June DeepSeek made the low number the real number and kept it
there. The chart caught the whole wobble.
DeepSeek V4 Pro · list price $/M input · nightly
$1.74
May 15
$0.44
Jun 1
$1.74
Jun 4
$0.44
Jun 11
Promo, list, revert, permanent. Four nights of price archaeology on a single tier, the
kind of thing you only see if someone is writing the number down every night instead of
trusting the marketing page.
What it means in real content
Token prices are abstract. So here is the part TokenScale exists to translate. The
Novel Index asks one question every
night: what's the cheapest price to make an AI write a whole novel, The Hobbit,
95,356 words? The floor has held near half a cent for weeks, and it stays
there precisely because providers like DeepSeek keep undercutting each other to hold it
down. A 75% cut on a frontier tier is what that floor looks like from underneath.
DeepSeek's reputation is the cheap-and-cheerful lite tier, V4 Flash at $0.14 per million.
What changed on 11 June is that the frontier reasoning tier now sits at
mid-tier prices too. The aggressor on price just brought the fight upmarket.
"The cheapest way to run a serious reasoning model dropped 75% in the middle of the
month, and the month wasn't over. If you priced your AI budget in May, it's already wrong."
Why the chart still shows the wobble
We don't smooth it out. On TokenScale a flat line means a price held and a step means it
moved, so DeepSeek's promo-then-revert-then-permanent fortnight stays on the chart as a
small permanent record: the two prices this tier wore in June, and the exact night the
low one stopped being a promo and became the truth. The marketing page only ever shows
you today. The chart remembers the path.
DeepSeek V4 Pro: $1.74/$3.48 to $0.435/$0.87 per 1M tokens. Cut made permanent 11 June 2026. Logged the same night.
0412 June 2026
The Three-Day Model
A frontier AI model launched on a Tuesday and was switched off by the
government on Friday. Our price chart caught the whole thing.
A
ANTHROPIC
Claude Fable 5 (high) · Flagship tier
$10 in · $50 out / 1M tokens
Opened: 6/14/2026Check: 1
Order: Backend DB projectReplies: 1
1 Message 1$119.70
$19.95 in + $99.75 out
Sticker price (msg 1)$119.70
TOTAL$119.70
Pay with Batch:$59.85 −50%
Pay with Cache:$101.75 −15%
17% of this check is re-reading
— Thank you! Come again —
The receipt the night Fable 5 was live, $10/$50, 2× Opus. See it live →
Every night, TokenScale checks the price of every
model we track and writes it down. It is the least dramatic job in the world. Most nights
nothing has changed, so the chart draws another flat step and goes back to sleep. A flat
line is the usual result, and that is the point: boring is what trustworthy data looks like.
This week the line moved.
What happened
On 9 June, Anthropic released Fable 5, its first generally available
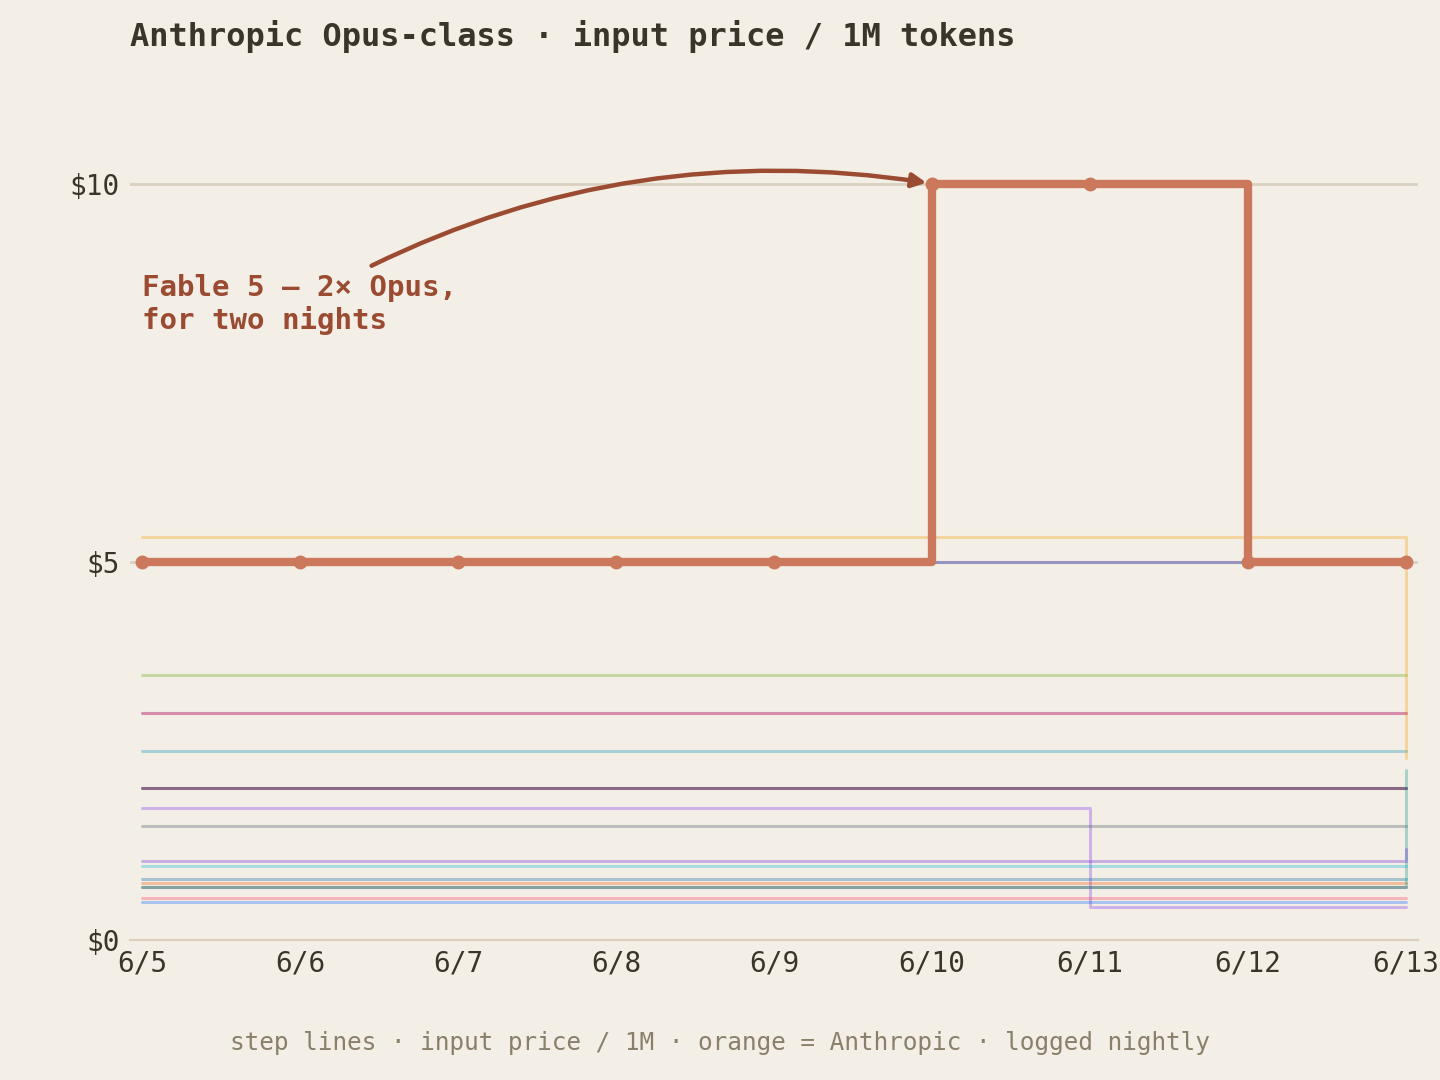
"Mythos-class" model, a tier above Opus. The next night, our Anthropic flagship slot
jumped: $5 / $25 to $10 / $50 per million tokens. Twice the price of
Opus 4.8. On the chart, the flagship line stepped up.
Anthropic flagship · list price $/M input · nightly
$5
Jun 9
$10
Jun 10
$10
Jun 11
$5
Jun 12
It held there for two nights.
Then, on the evening of Friday 12 June, the US government handed Anthropic an
export-control directive ordering it to cut off Fable 5 and its sibling, Mythos 5, for
any foreign national, inside or outside the country. Because an order that broad reaches
everyone, including Anthropic's own staff, the only way to comply was to switch
the models off for the whole world. Anthropic did it within hours. Every other Claude
model stayed up. (The reported trigger, via Axios: another company claimed it
had jailbroken Mythos.)
By our next price check, the flagship slot was Opus 4.8 again. $5 / $25.
The line stepped back down.
Two nights up. Then gone.
Why the chart still shows it
We do not erase the spike. On TokenScale a flat line means a price held and a step up
means it rose, so the Fable 5 episode is now a small permanent marker on the Anthropic
chart: the two nights a model sold at twice the price of Opus, bracketed by the day it
launched and the day it vanished. You cannot buy it anymore. The chart remembers that
you briefly could.
I had just rebuilt the part of TokenScale that renders this: the interactive
receipt, where the model list is the menu and the receipt is your check.
It was an idea I had been sitting on for a while. It landed in a single night and a
handful of prompts, and came out leaner than the thing it replaced, about
20% fewer lines of code than I
started with. The first real event it ever printed was the death of a frontier model.
"I built a tool to log AI prices every night because most nights are boring. Then a
model lived for three days, and the boring little tool was the only thing watching."
Two nights at twice the price of Opus: Fable 5's brief spike, caught in the nightly log. See it live →
Fable 5: launched 9 June 2026. Pulled 12 June 2026. Logged in between.
036 June 2026
The Chart: AI Models Ranked Like the Pop Charts, Except the #1 Is Yours
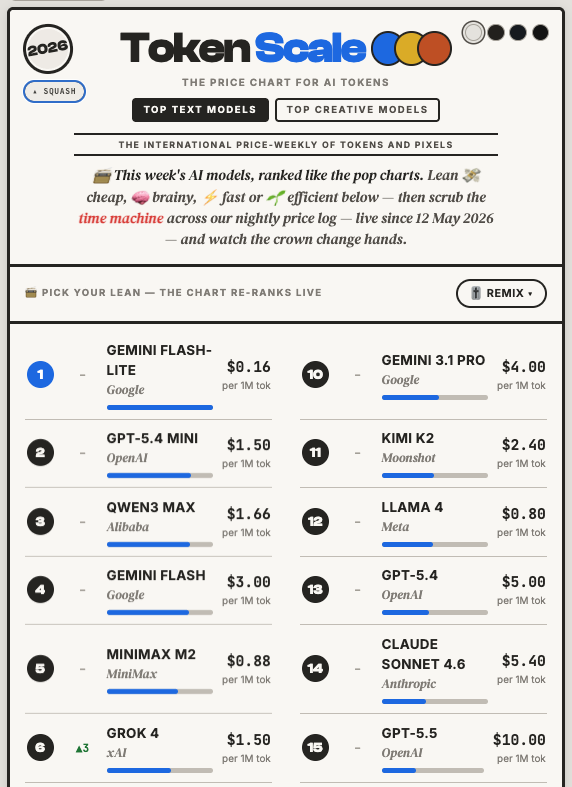
A new sister-site experiment: this week's AI models, ranked like a singles chart.
Lean toward price, brains, speed or energy and the whole thing re-ranks, live.
Play the Chart →
Pop charts have been counting down the hits since 1913. That summer, Billboard
printed its first ranking, "Last Week's Ten Best Sellers Among The Popular Songs",
based on sheet music people bought to play on the piano at home. The format outlived
the piano, the record, and the radio. We still love a countdown.
So I built one for AI models.
The problem with a "best model"
Ask which AI model is best and you'll get an argument, because everyone's asking a
slightly different question. Some people want the cheapest thing that works. Some want
the sharpest answer regardless of cost. Some want speed. A few of us care about energy.
Those are four different charts. Most rankings pretend they're one.
TokenScale already does the hard part, turning
"$5 per million tokens" into money you can picture. The Chart is the playful sibling:
it takes the same nightly price data and lets you lean.
How it works
There's a dial. Pull it toward price 💸, brains 🧠, speed ⚡ or energy 🌱, and the whole
chart re-ranks in front of you. The model that suits you rises to the
top and gets the crown 👑. Lean a different way and someone else takes it.
Then there's the time machine. Every rate on the Text chart comes from our own price
checks, logged nightly since 12 May 2026. Scrub the dial back through the log and watch
models climb and fall as prices moved, a countdown that runs backwards as well as
forwards. It's the same idea as a singles chart. The difference is that the audience of
one is you.
What it is, and isn't, yet
This is an early beta, and I'd rather say that plainly than oversell it. The price log
is young, a few weeks deep and growing every night. We used to show a hand-reconstructed
2023–2025 era here and I pulled it, because this page should only say things we can back
with our own data. The Creative chart is still hand-curated for now.
So treat it as a toy that's becoming a tool. Have a play, lean it your way, and if a
number looks wrong, tell me, that's literally
how the history gets better.
When TokenScale launched, it compared 16 providers. As of tonight it compares
21. I added the five names that had become impossible to leave off, four
Chinese frontier labs and Meta's own first-party API.
Providers tracked
21
was 16
New labs added
5
2 June 2026
Price points / night
63
21 × 3 tiers
Infra cost
$0
still Cloudflare free
Who Joined
DeepSeek used to be the lone Chinese lab on the board. That stopped making sense, there are
now four open-weight labs people genuinely compare against each other every day:
Alibaba Qwen, Qwen-Flash, Plus and Max. Leads the open-weight tool-calling benchmarks.
Zhipu GLM, GLM-5 tops several open-weight leaderboards and is MIT-licensed.
Moonshot Kimi, K2.6 is a favourite for agentic and coding work.
MiniMax, the M-series, cheap and popular for agent workloads.
Meta Llama, Meta now hosts Llama on its own API, so you no longer have to go through a reseller to get a first-party price.
Why It Matters
The whole reason TokenScale exists is to show that the floor keeps dropping. Four of these five
are open-weight, and they price like it, a Qwen-Plus or a Kimi sits an order of magnitude below
a US frontier flagship for many jobs. Putting them next to GPT and Claude in plain content terms
is the clearest way to see how much pressure the open labs are putting on price.
Being Honest About the Data
Two caveats, because this is a build-in-public journal and not a press release. A few top-tier
prices, Kimi's Turbo variant, MiniMax's Pro tier, Meta's Behemoth, aren't published yet, so
those are careful estimates I'll correct the moment real numbers appear. And the new providers
start with a flat price line: the nightly tracker only began watching them tonight, so their
history builds from here, the same way every other provider's did.
Same as always: one HTML file, no framework, verified each evening. Now just five labs wider.
0130 May 2026
12 Days In: 1,400 Visitors, a Netherlands Mystery, and What Comes Next
TokenScale launched on 18 May 2026. No budget, no team, no existing audience.
Just a single HTML file on Cloudflare and a LinkedIn post.
Twelve days later, here's what the data looks like. And more importantly: what I think it means
for where LLM pricing is heading.
The Numbers
Unique visitors
~1,400
May 18 to 30
Peak day
486
May 20 · launch
Cache hit rate
92%
Cloudflare avg
Infra cost
$0
Cloudflare free
The Shape of the Launch
Unique visitors per day · May 18 to 24
70
May 18
69
May 19
486
May 20
164
May 21
119
May 22
94
May 23
86
May 24
May 20 was the day I posted to Hacker News (Show HN) and LinkedIn simultaneously.
Traffic jumped from a 70/day baseline to 486 unique visitors. The following days settled
into a floor of around 85 to 90 per day. Nobody paid for that. It just held.
Product Hunt went nowhere. I launched cold with no community, ended at #82 with 2 points.
That was expected. PH rewards existing audiences, not new ones.
Hacker News was the real driver.
Where Traffic Came From
1
🇳🇱 Netherlands
309
2
🇺🇸 United States
190
3
🇩🇪 Germany
51
4
🇸🇪 Sweden
34
5
🇨🇦 Canada
29
Netherlands at #1 with more traffic than the US. I still don't know exactly why.
Hacker News skews heavily toward Northern European readers, so that is probably part of it.
Something may also have been shared in a Dutch or German developer community I'm not aware of.
If you came from one of those: I'd genuinely love to know where.
What I do know: EU developer communities responded faster than the US ones.
That's useful information for where to focus outreach next.
What the Pricing Chaos Showed
May 2026 was one of the most volatile months in LLM pricing history. On or around May 15:
OpenAI's o3 Pro dropped 80%. xAI Grok dropped 83%. DeepSeek dropped 75%.
Gemini Pro went up 60%.
These are enormous moves. And most developers had no simple way to track them.
The tool launched at exactly the right moment. Not because I planned it that way,
but because AI pricing has become genuinely hard to follow.
The nightly price history in TokenScale is now 12 days old. Every day that passes
adds something no competitor can buy back.
How It Was Built
One HTML file. No framework. No backend. No build step.
Hosted on Cloudflare Pages for free. Built entirely on my phone, using Claude,
over about 11 months of conversations.
I'm not a developer in the traditional sense. I'm an animation professional, with years earlier as a software QA engineer, so reading and writing code was never foreign to me, who started building things by talking to AI in 2025 and couldn't stop.
The nightly price check that now runs automatically at 8pm? That's also a prompt.
It searches 16 provider pages, writes a JSON file, takes a backup, and tells me what changed.
No server. No pipeline. Just a scheduled task.
My Prediction
PredictionWritten 30 May 2026. I'll respond to these next post.
→
Price change events will become the main growth driver.
Every time a major provider moves pricing, developers search for comparisons.
TokenScale should catch that traffic organically, without any promotion.
The nightly update cadence exists exactly for this.
→
The baseline will hold at 80 to 100 visitors per day until
the next catalyst: a Reddit post, a Dev.to article, or a significant model
price announcement. Those are the levers I haven't pulled yet.
→
The price history dataset becomes a citation.
By September, if the nightly data keeps running, TokenScale will have
the most complete public record of LLM pricing changes available anywhere.
Journalists and researchers will eventually link to it.
That is the long game.
→
Pricing will keep falling, fast.
The 80% drop in o3 Pro is not an anomaly. It is the direction of travel.
Commoditisation is happening at speed. The tools that help developers
navigate it will matter more, not less, as the noise increases.
Next update in a few days. Drop me a note if you have a question or a pricing
anomaly worth investigating: projectsbilton@gmail.com